Welcome to Enigma-Vis!
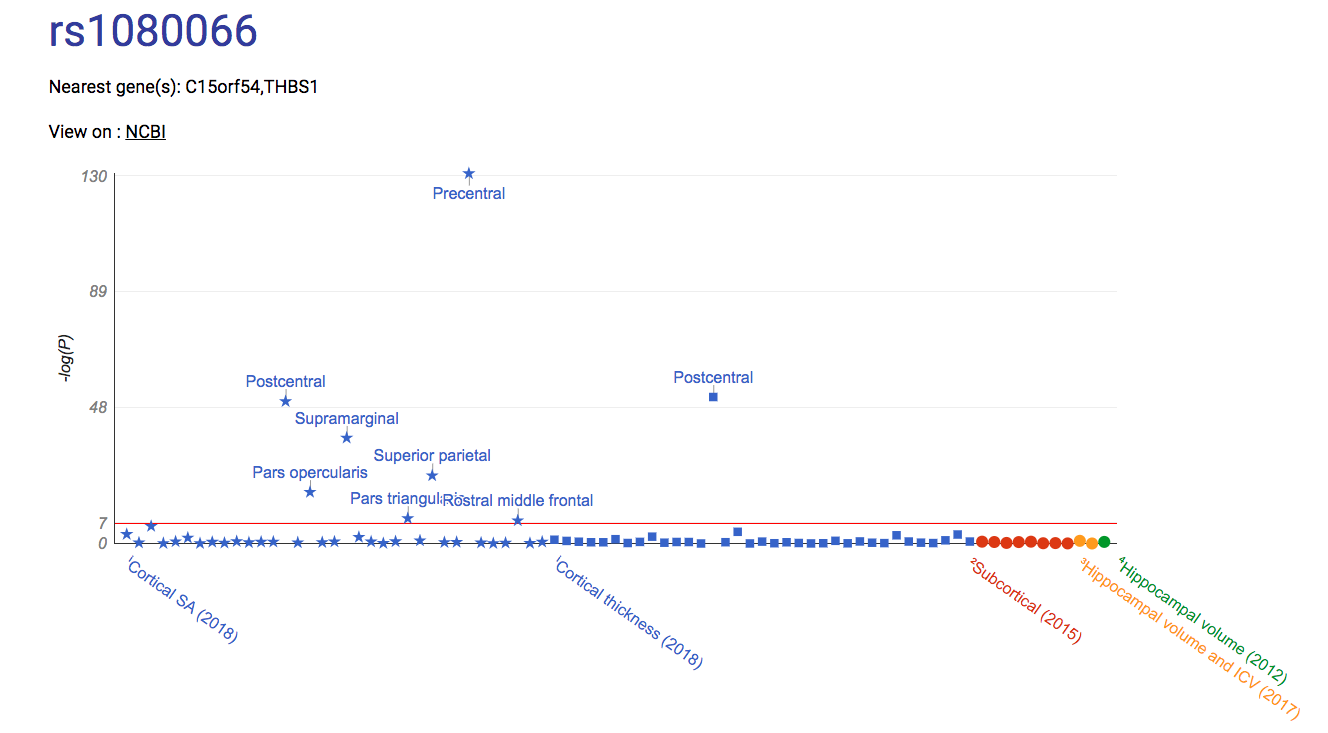
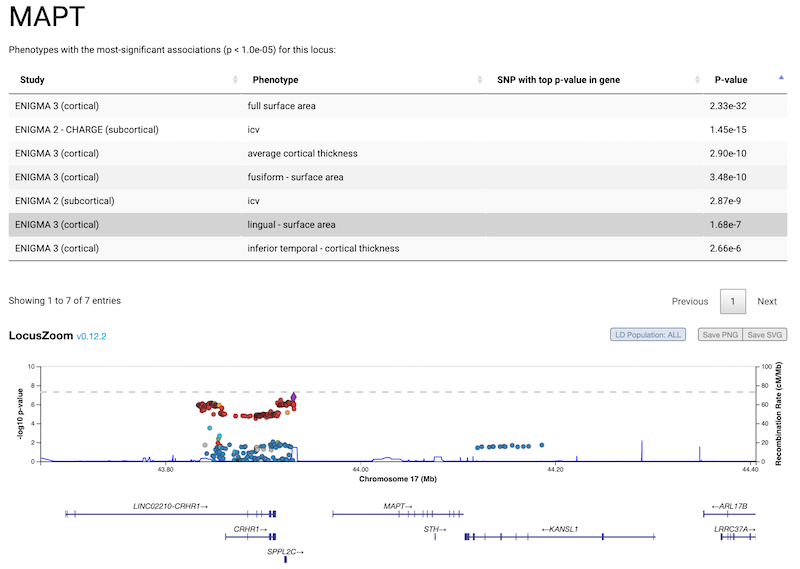
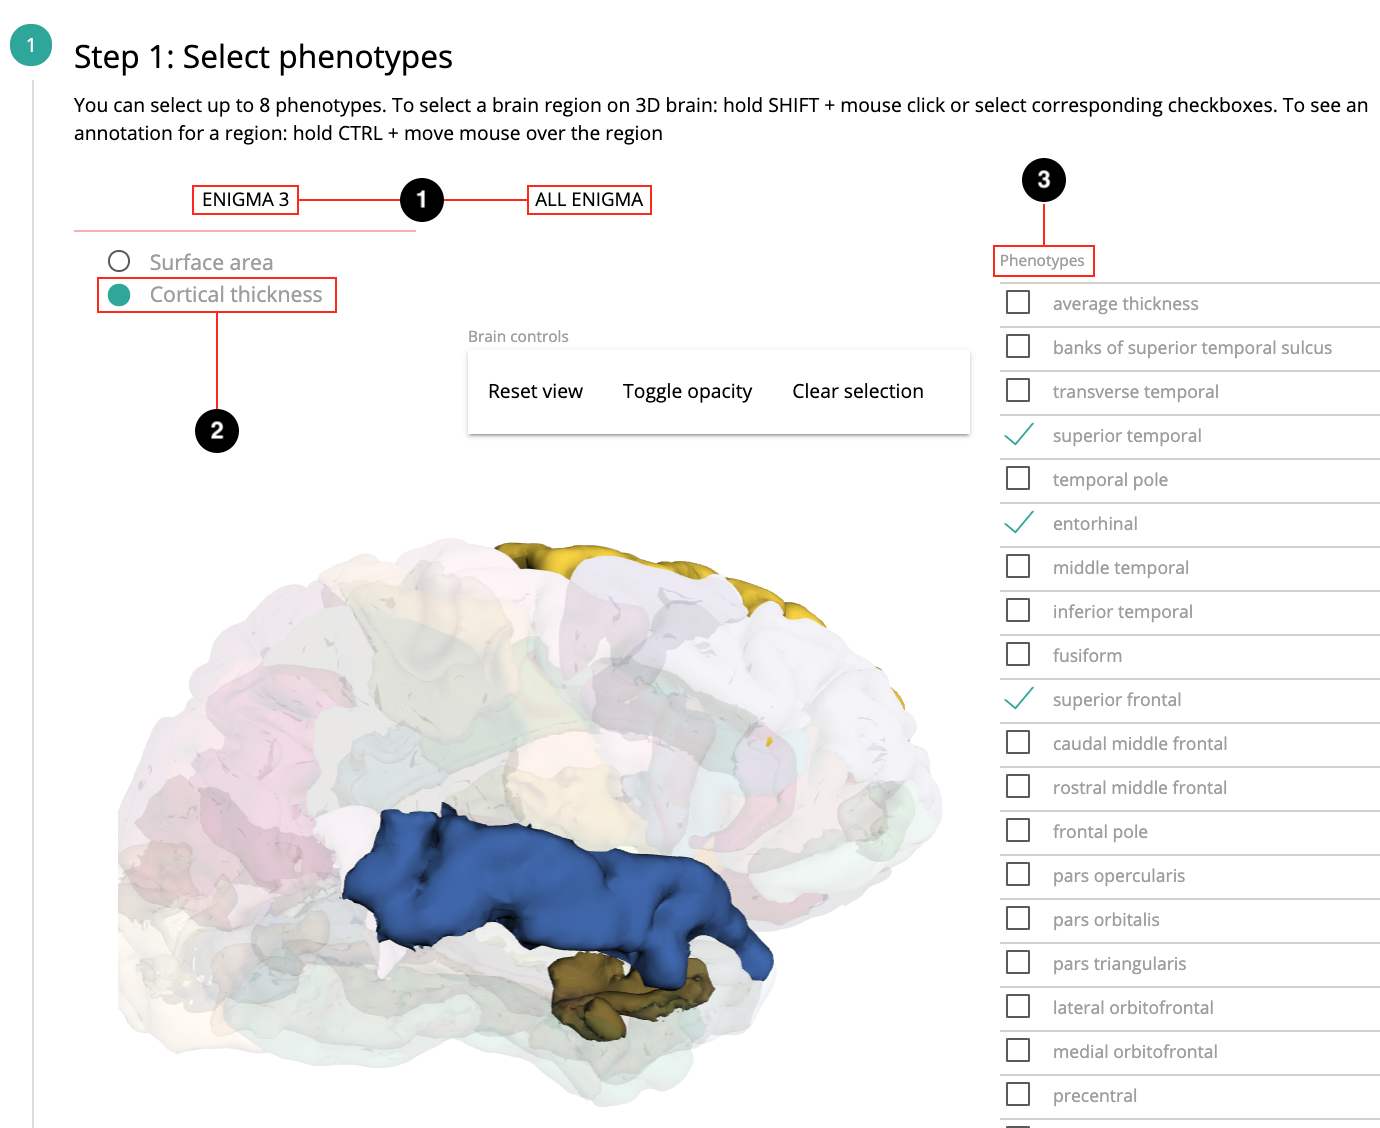
Generate regional plots
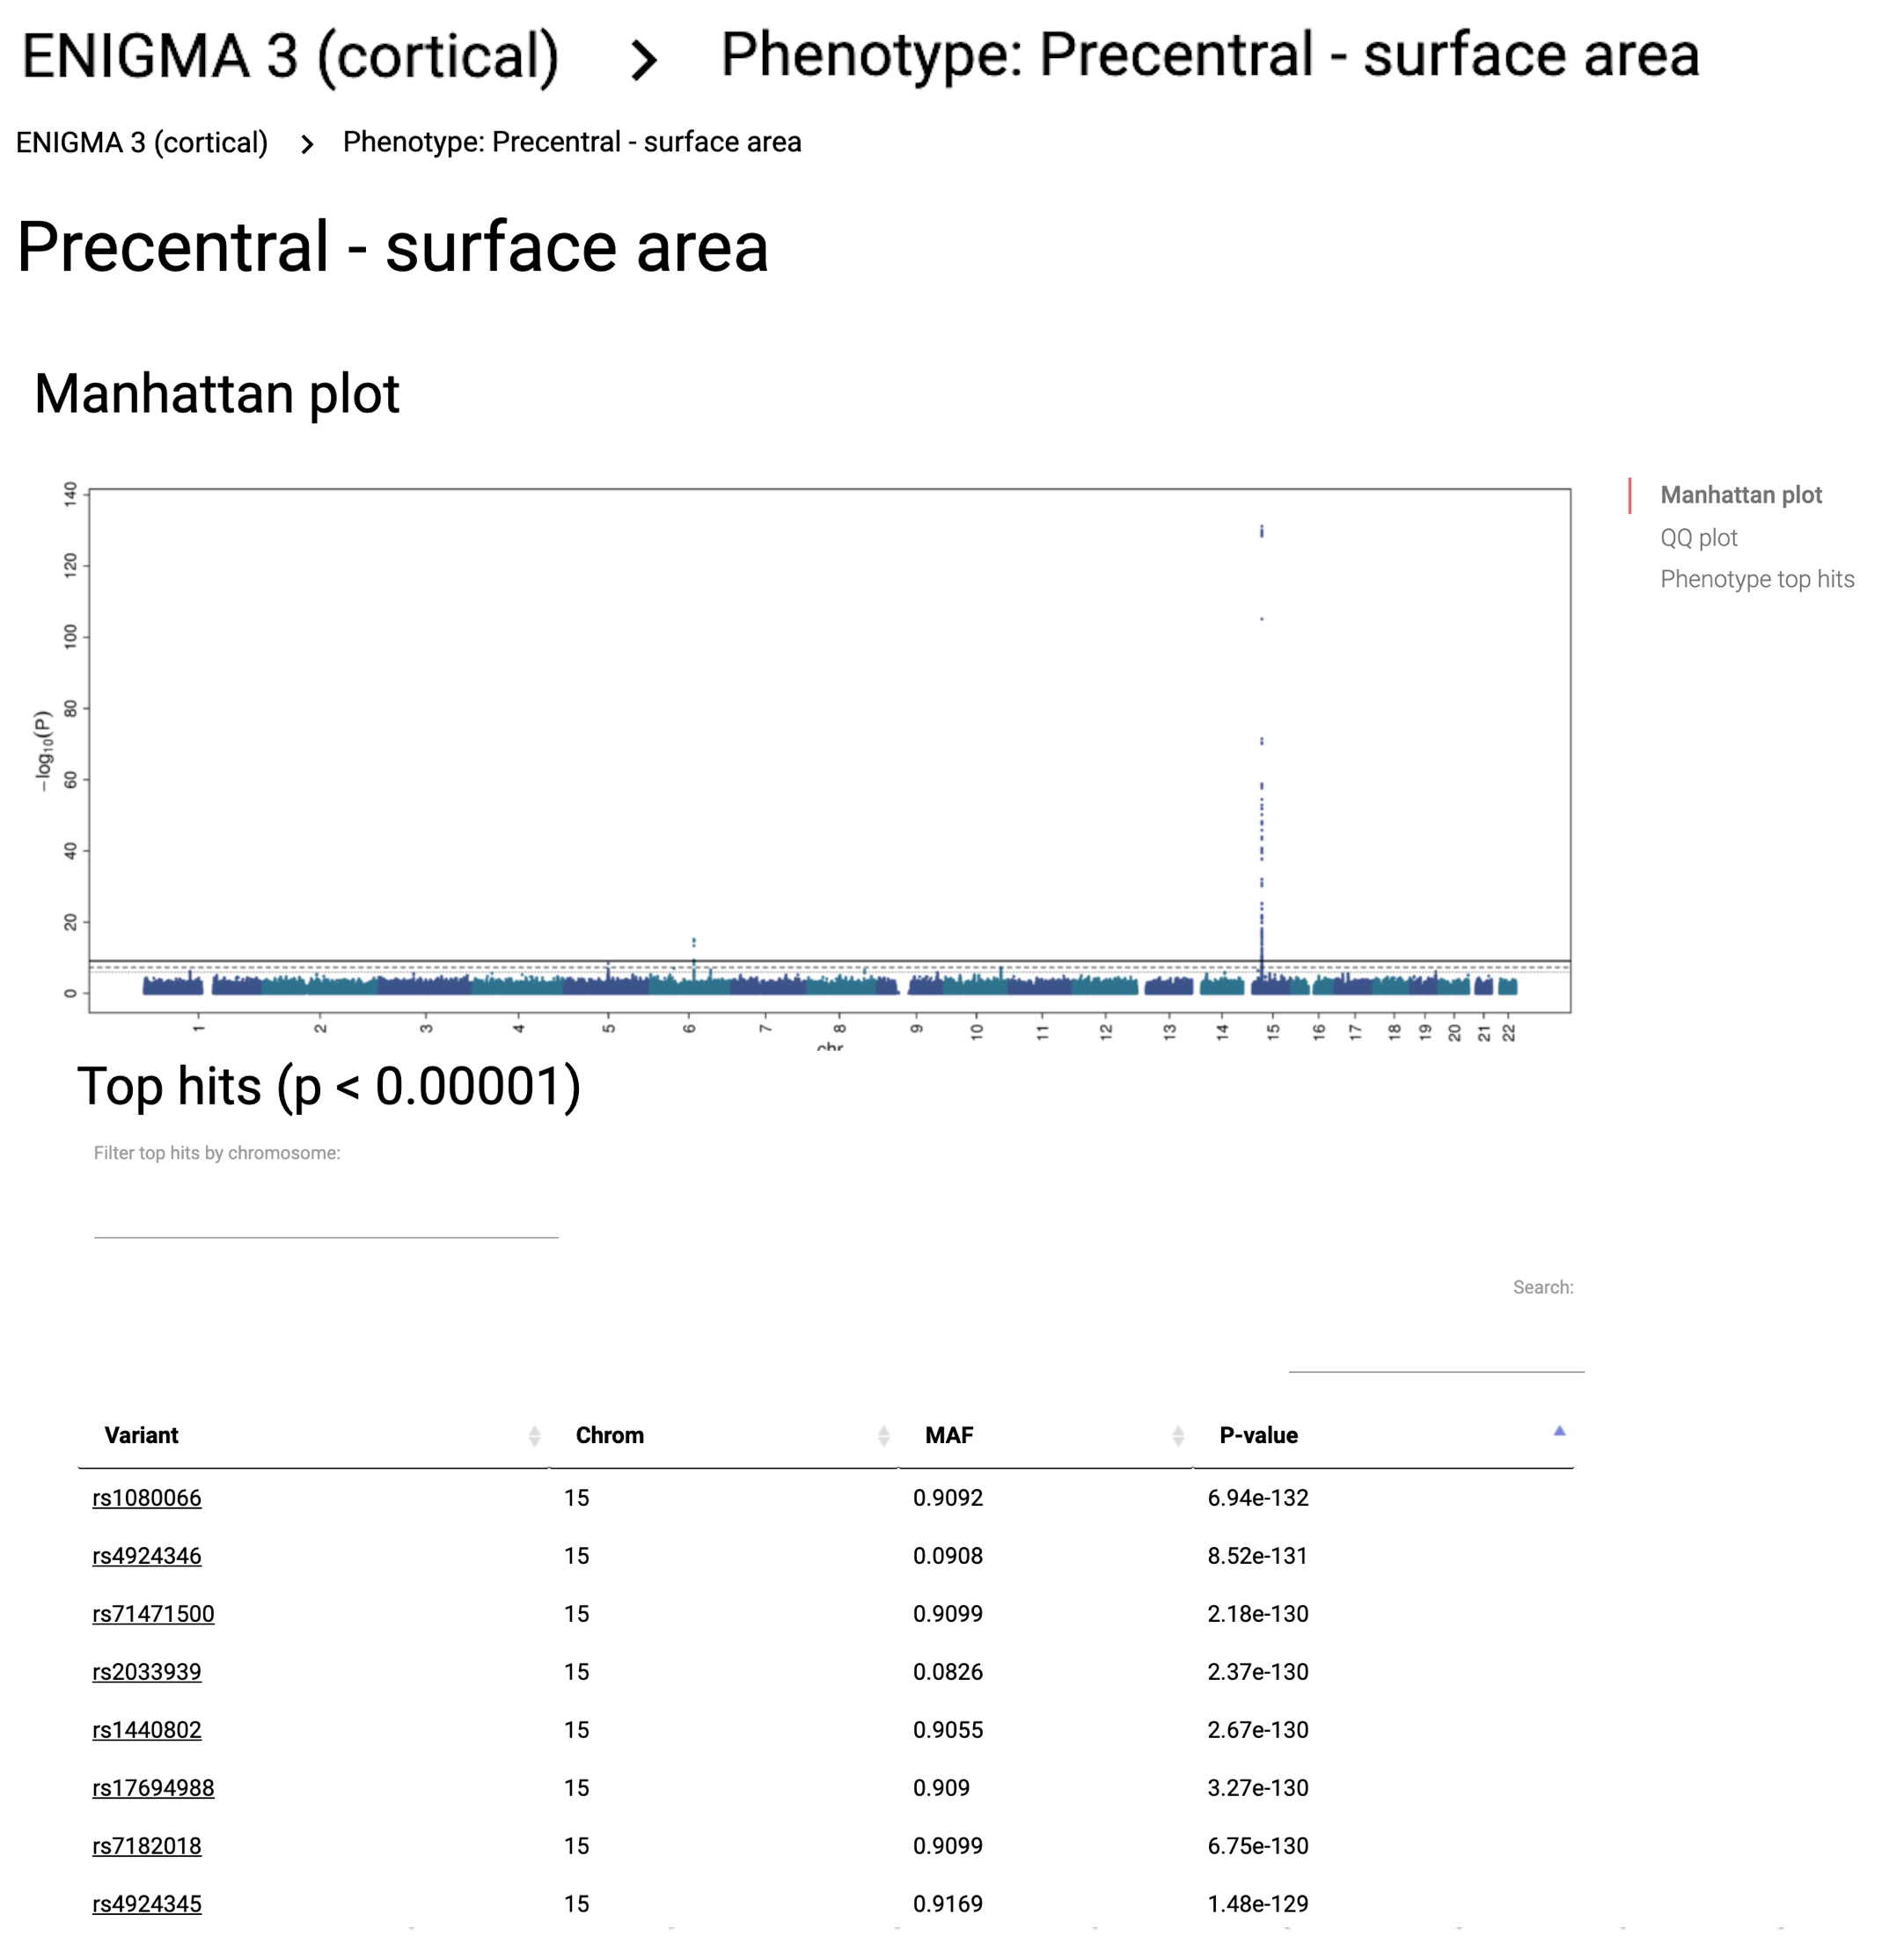
A tool for making regional plots from ENIGMA summary statistics data.
Main components
1. Datasets selection tabs
2. Category toggle button (for the Enigma 3 datasets)
3. Checkbox list of the Enigma 3 phenotypes
4. Query term input field
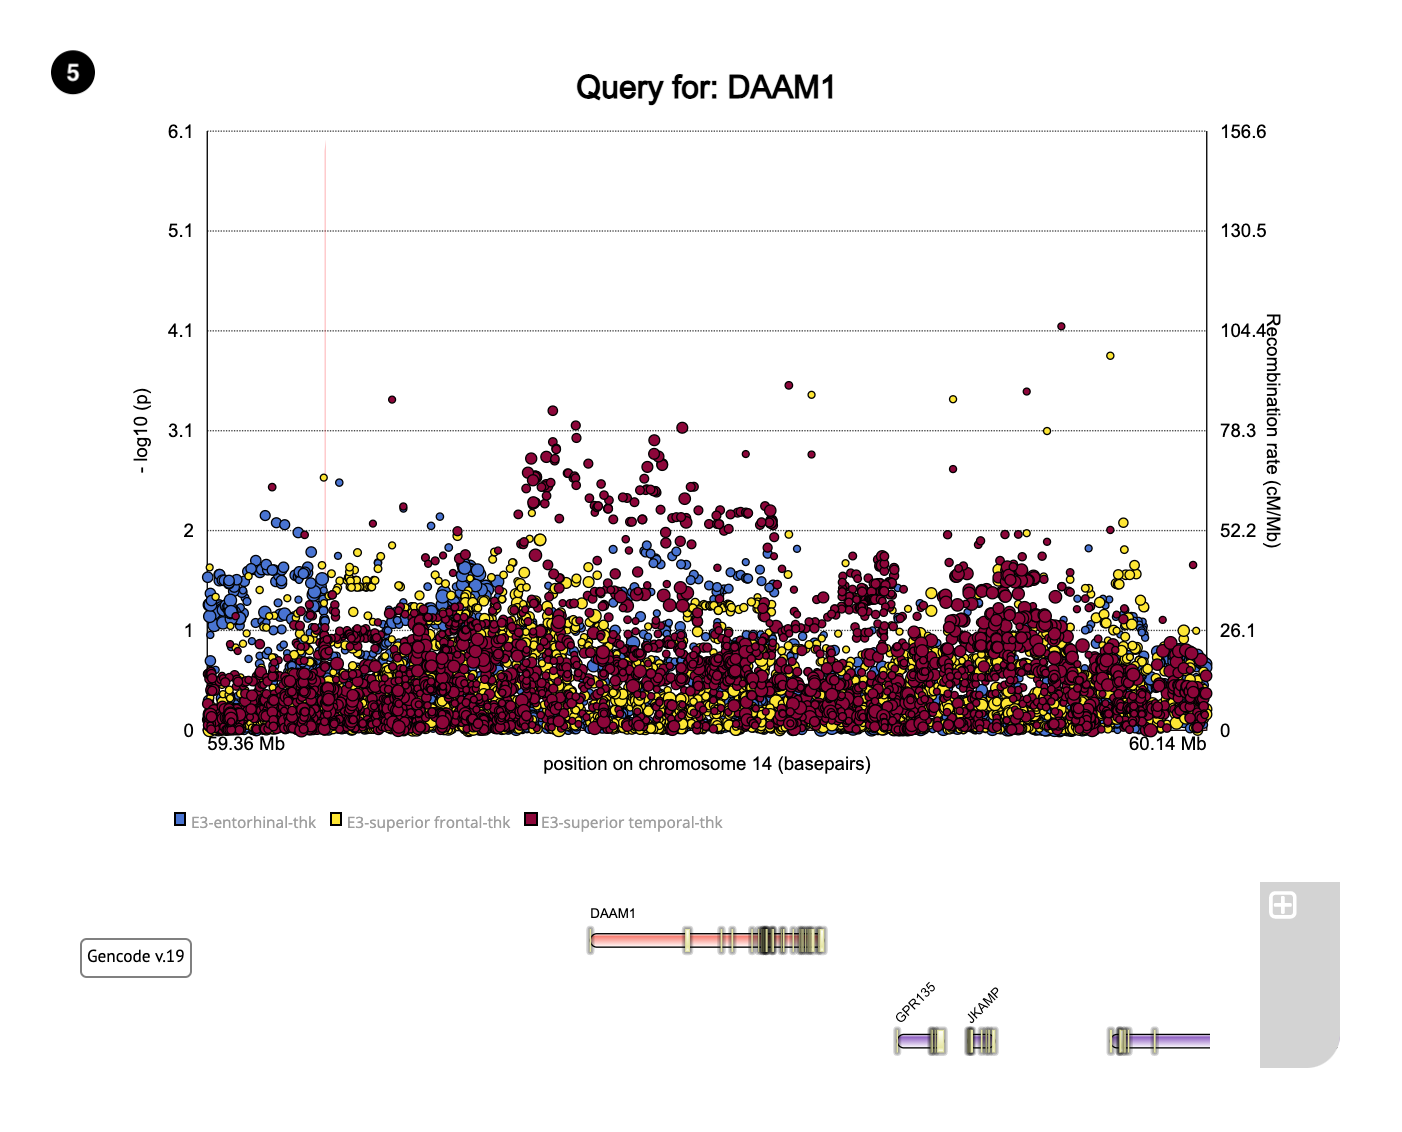
5. Resulting plot

Color brain regions
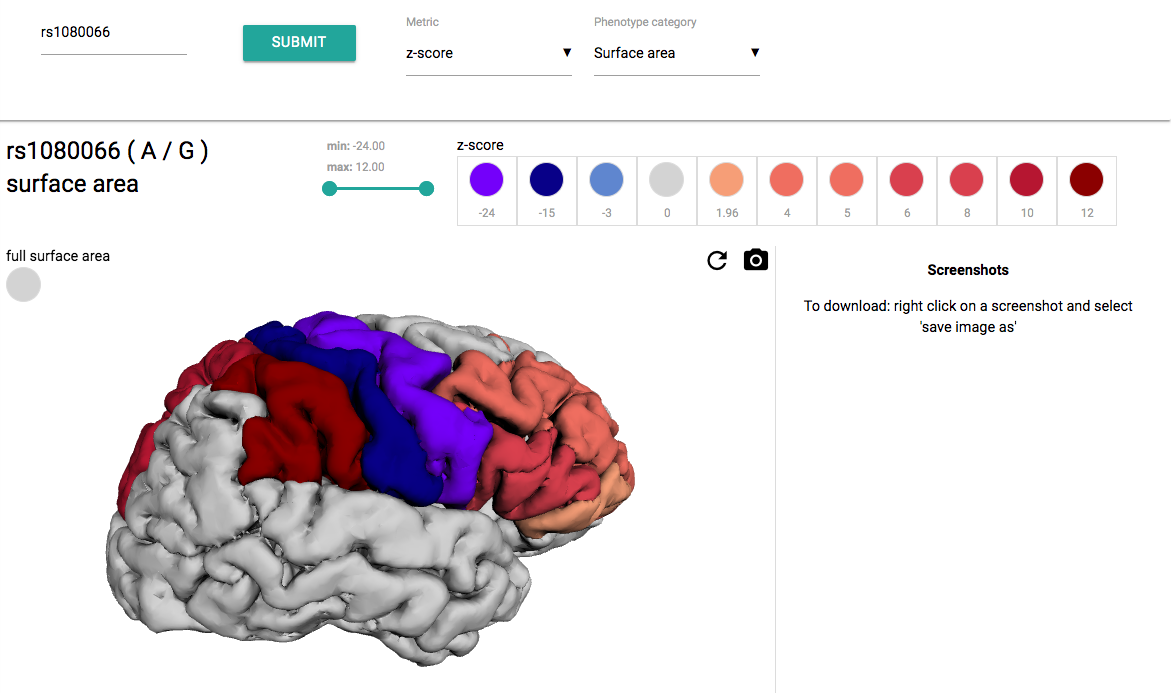
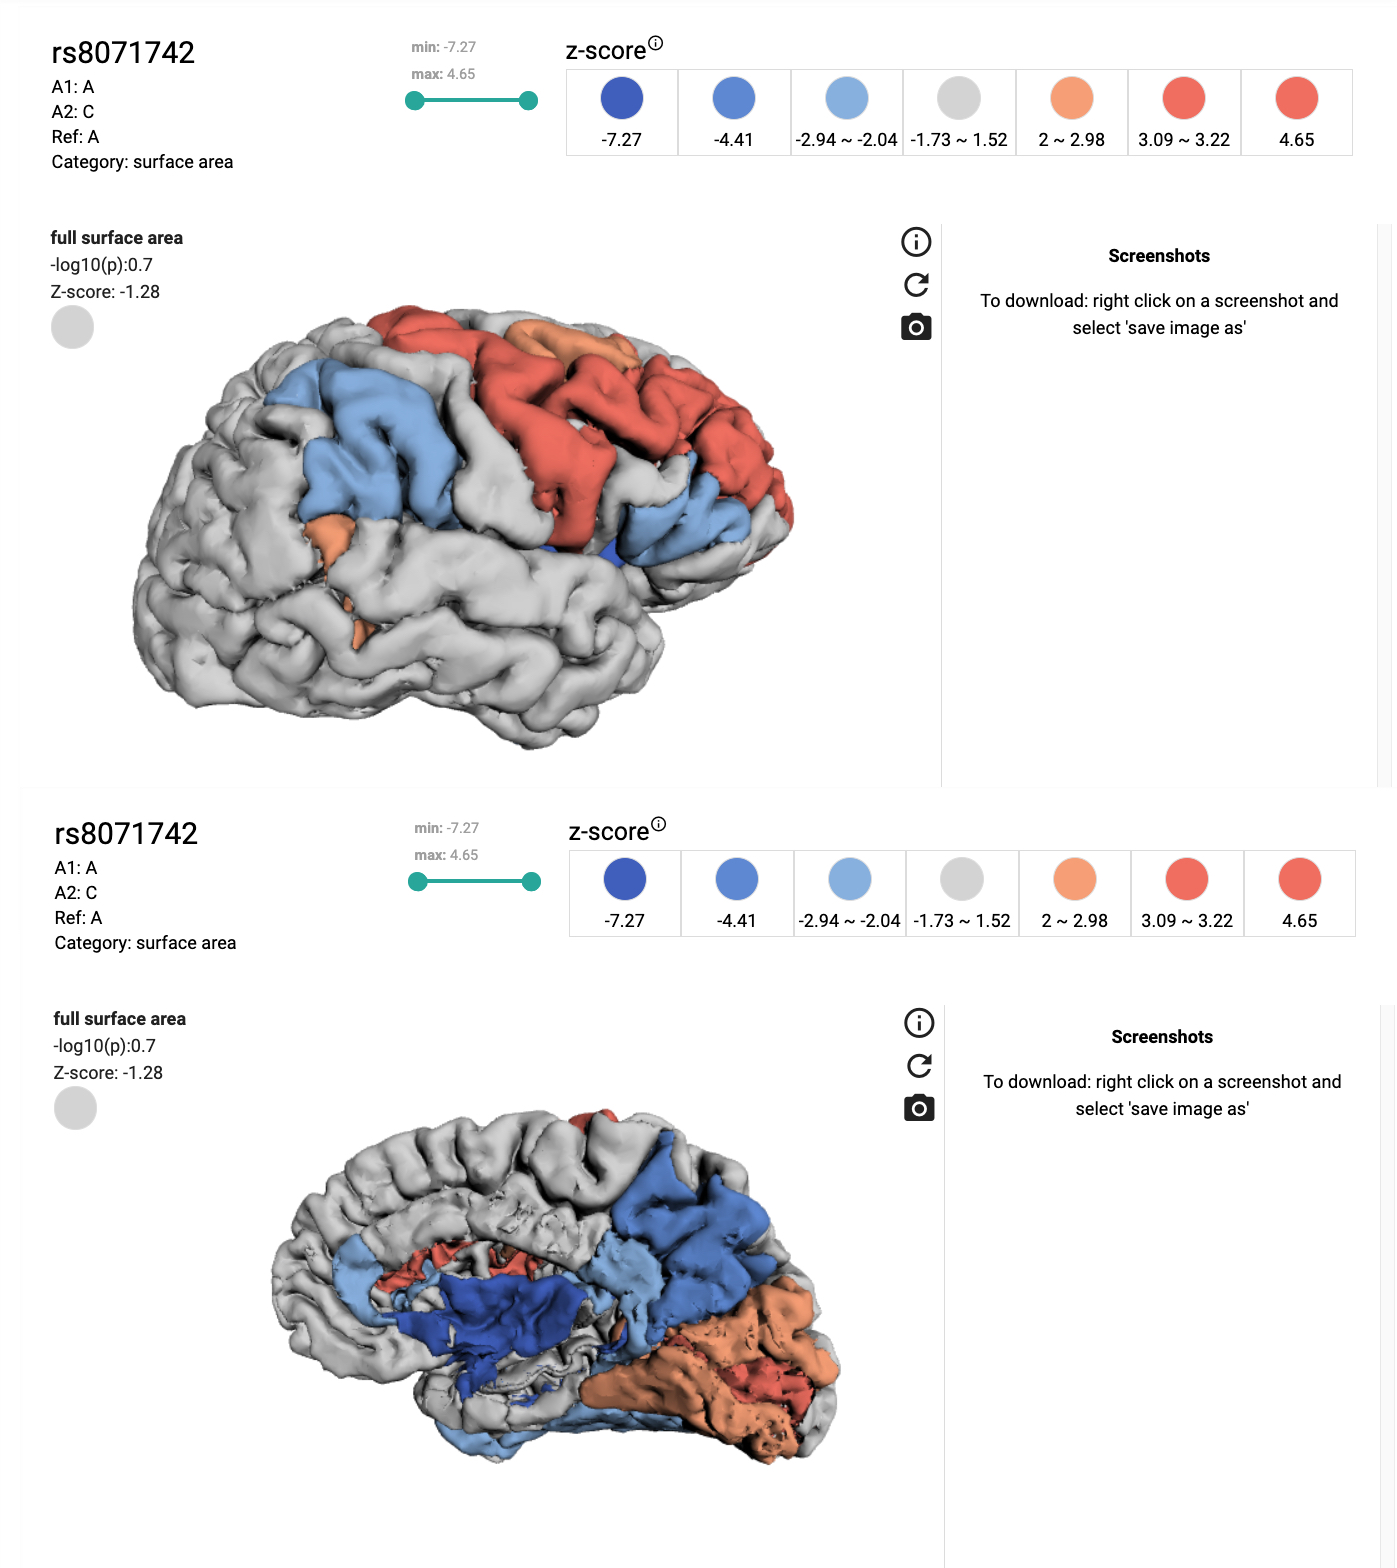
This tool is programmed to make 3D cortical maps for a query SNP. It maps either p-value or z-score using the summary statistics data from the Enigma 3 study. The cortical map's colorscale colors and range are user customizable. The map shows region annotations. To see them position the mouse pointer over a region and hold CTRL key at the same time.
EXAMPLE: z-score map for rs1080066 with customized colorscale color.To generate this map, 'z-score' was selected from the metric dropdown menu, then 'surface area' was selected from the category dropdown menu, rs number was entered in input field and submitted. The color of the z-score = -24 was then adjusted by clicking on the corresponding circle and selecting a new color from a dropdown palette.
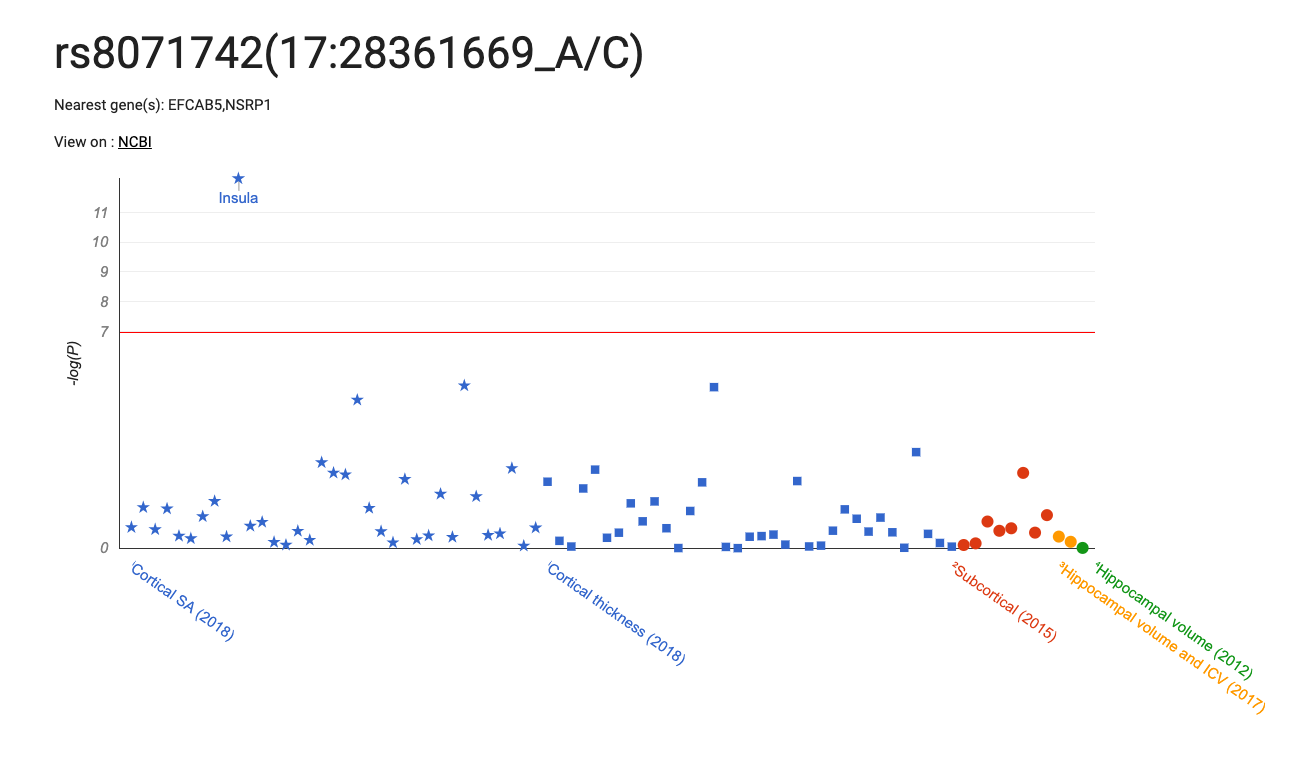
NOTE: currently only top findings from Supplementary Tables 1-19 are included in query results.
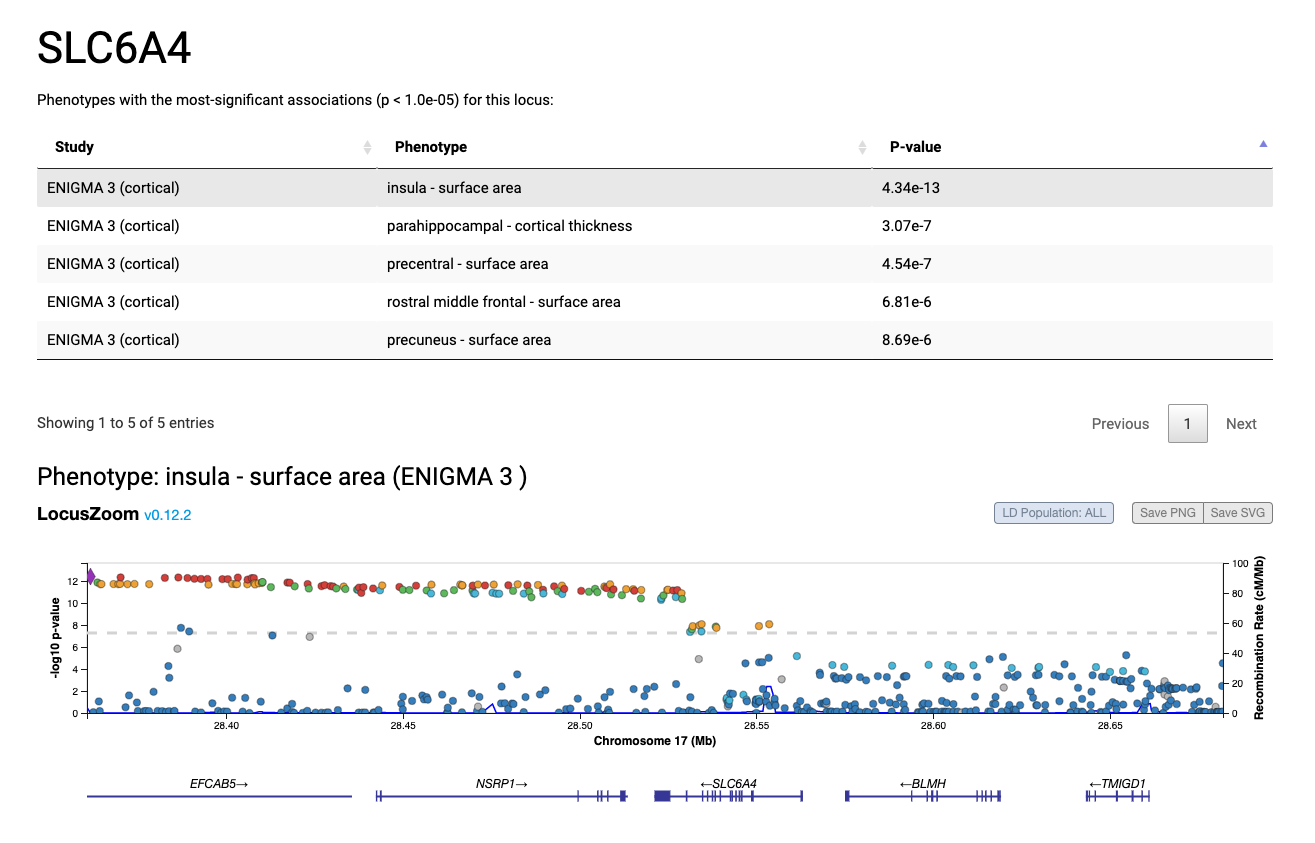
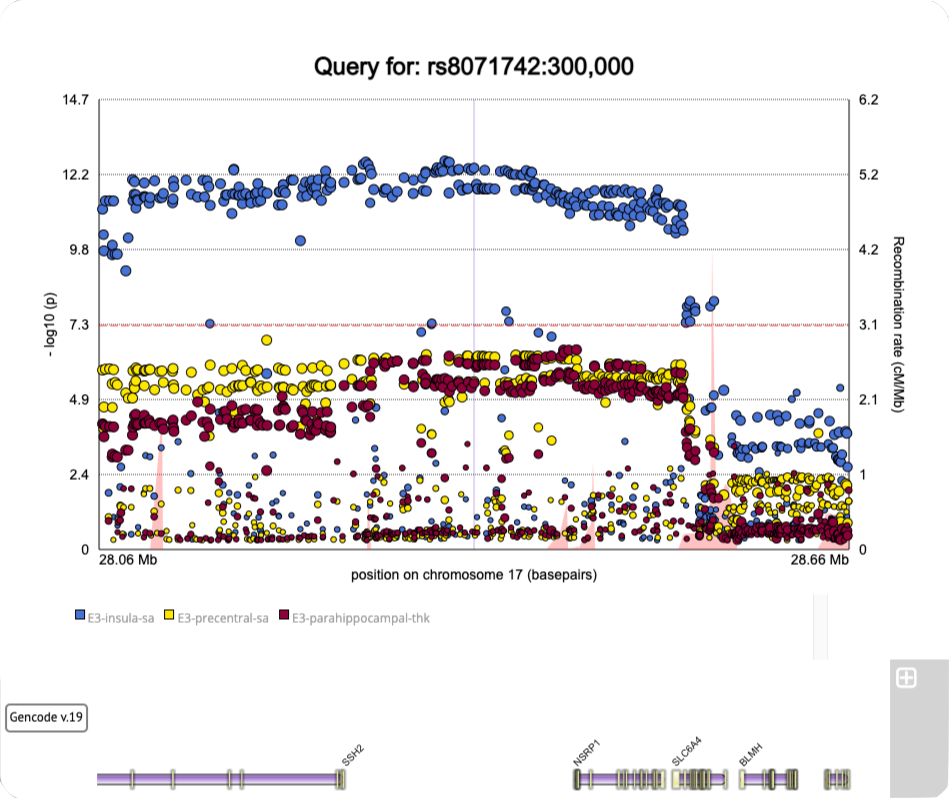
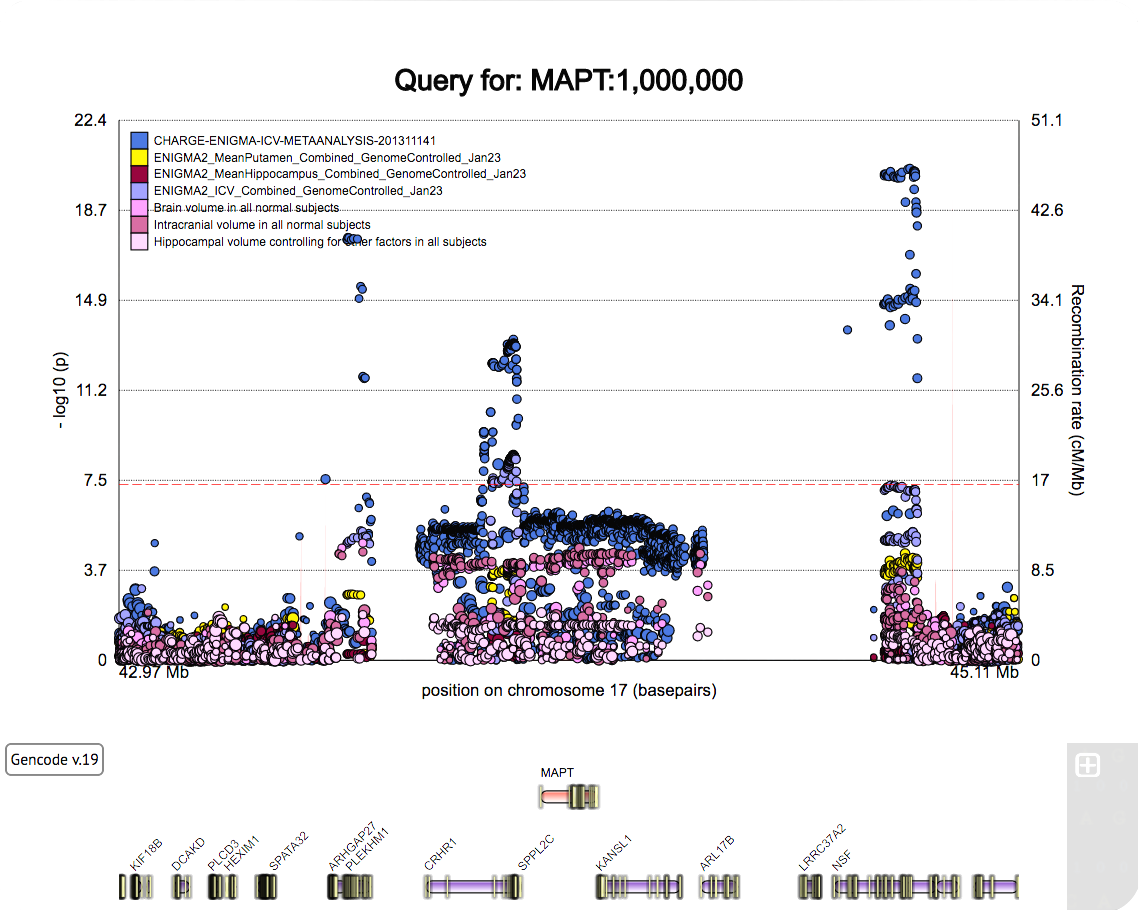
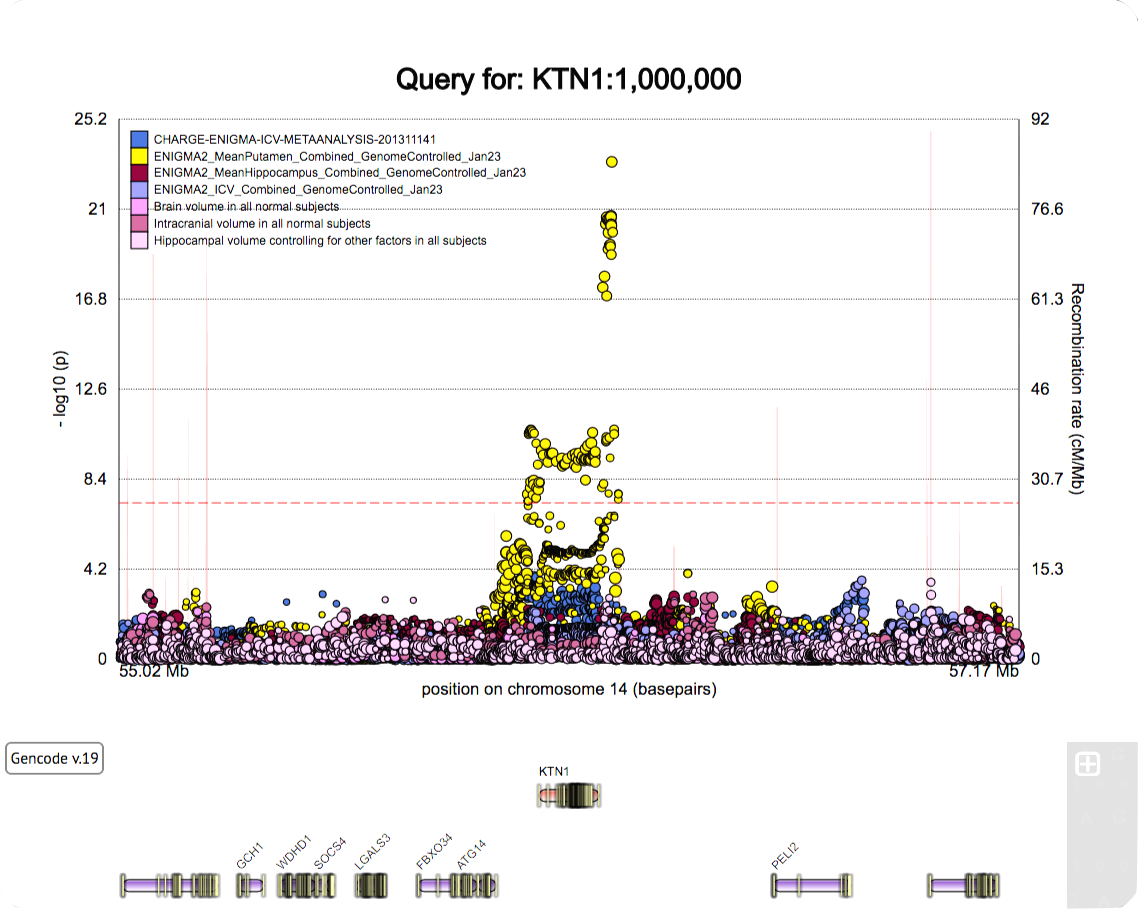
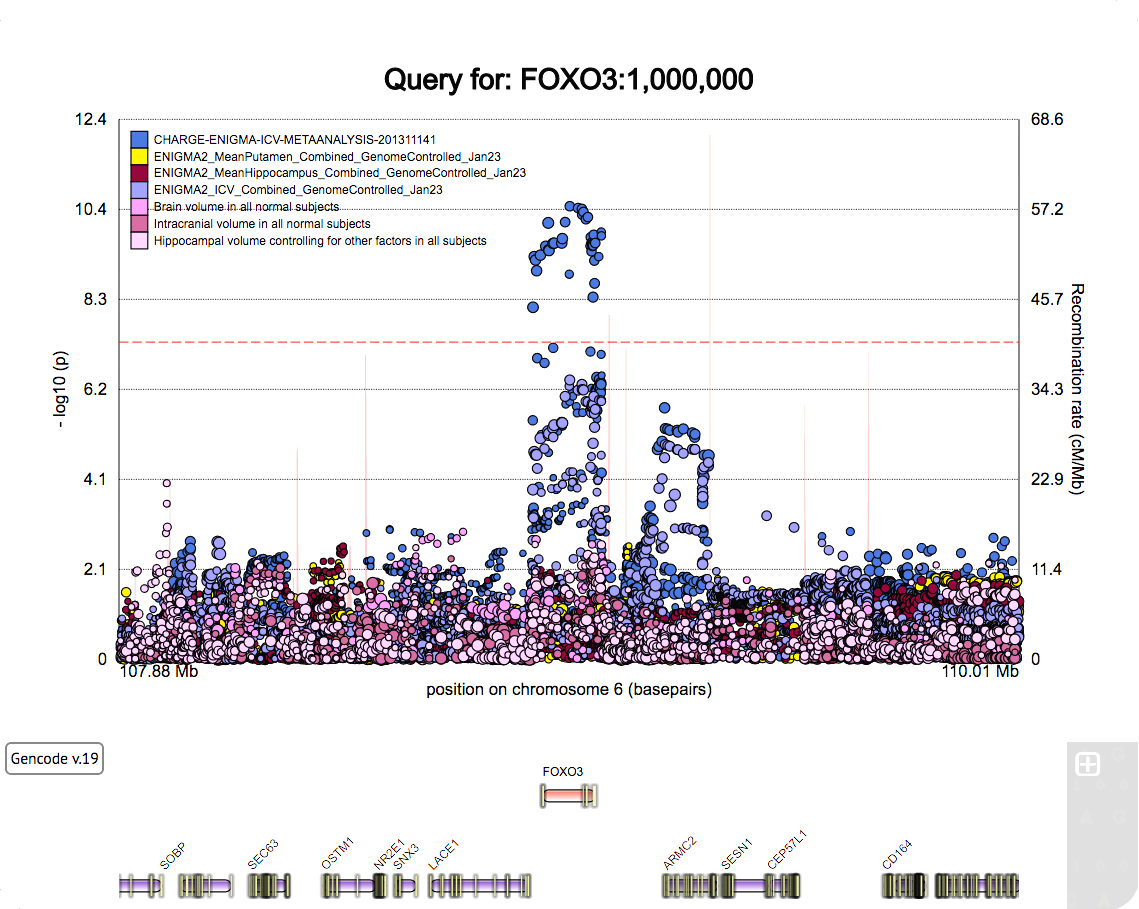
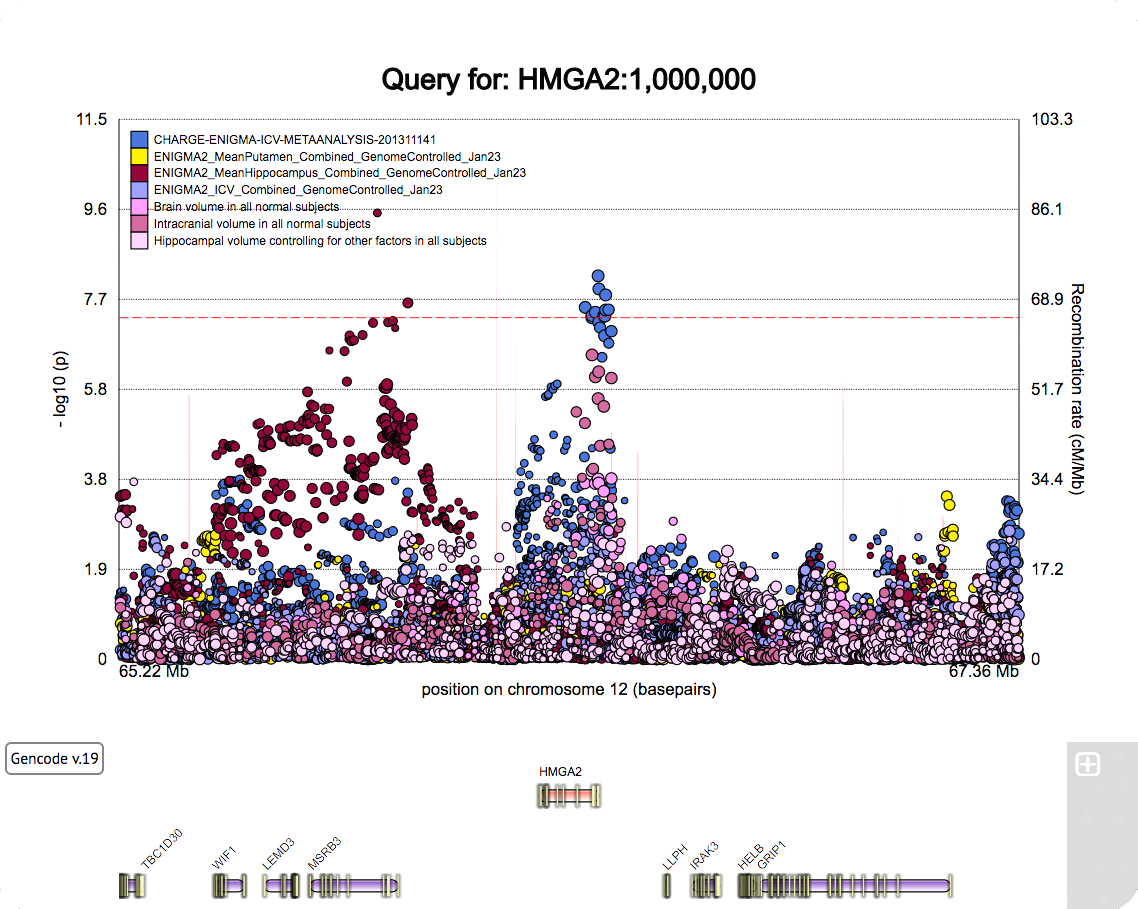
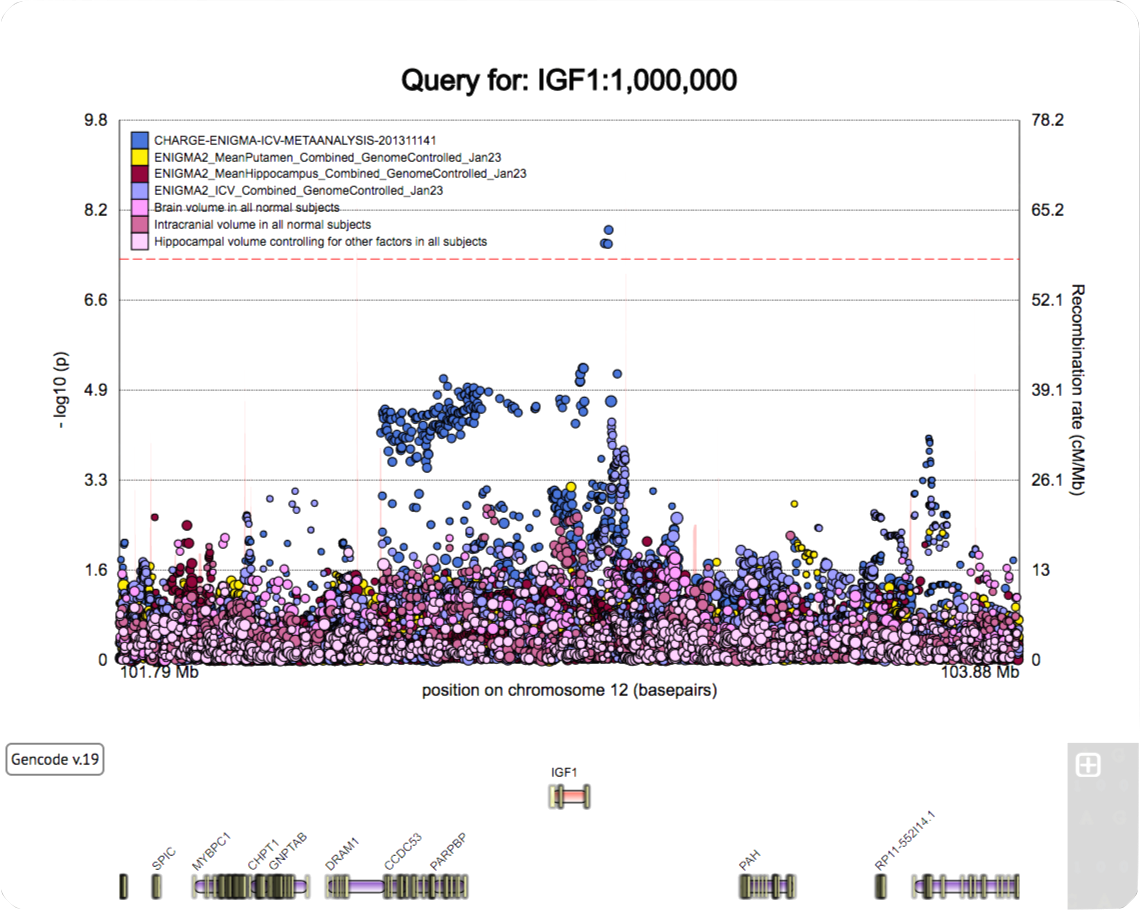
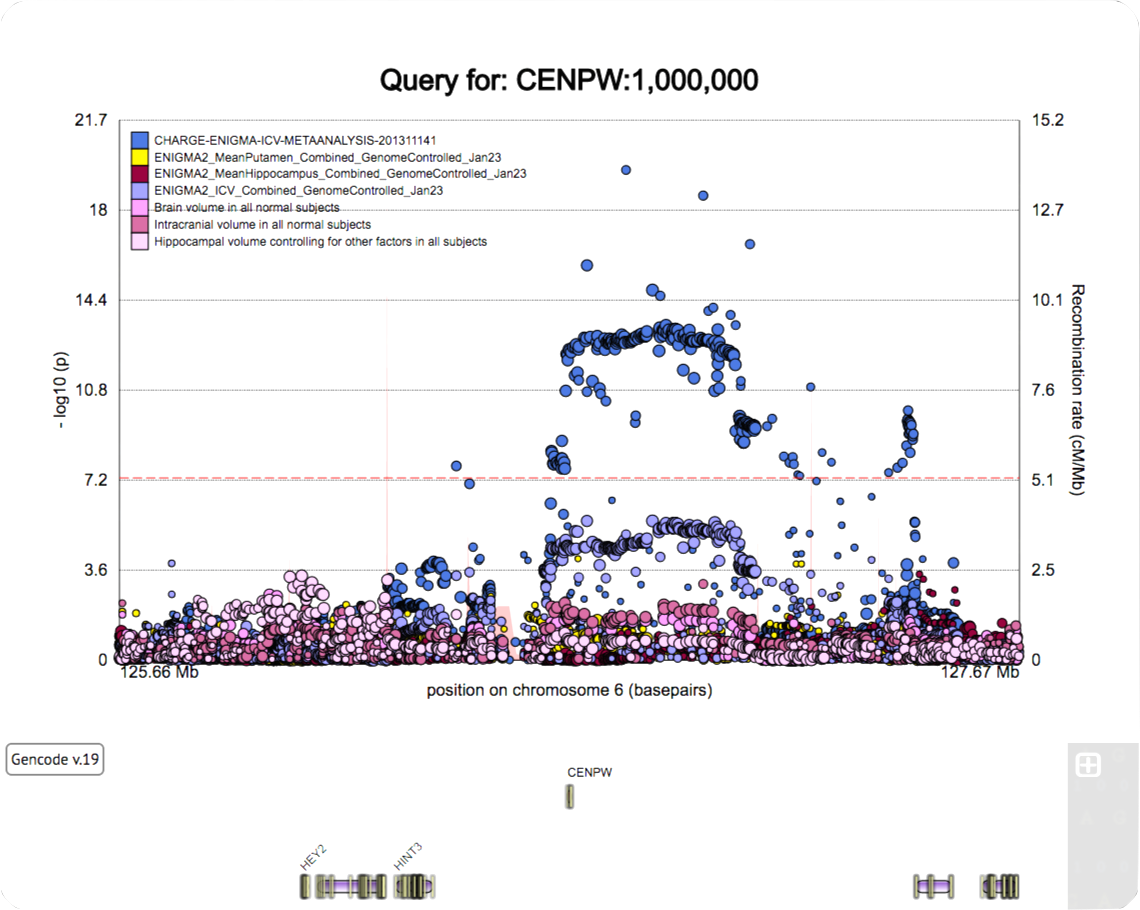
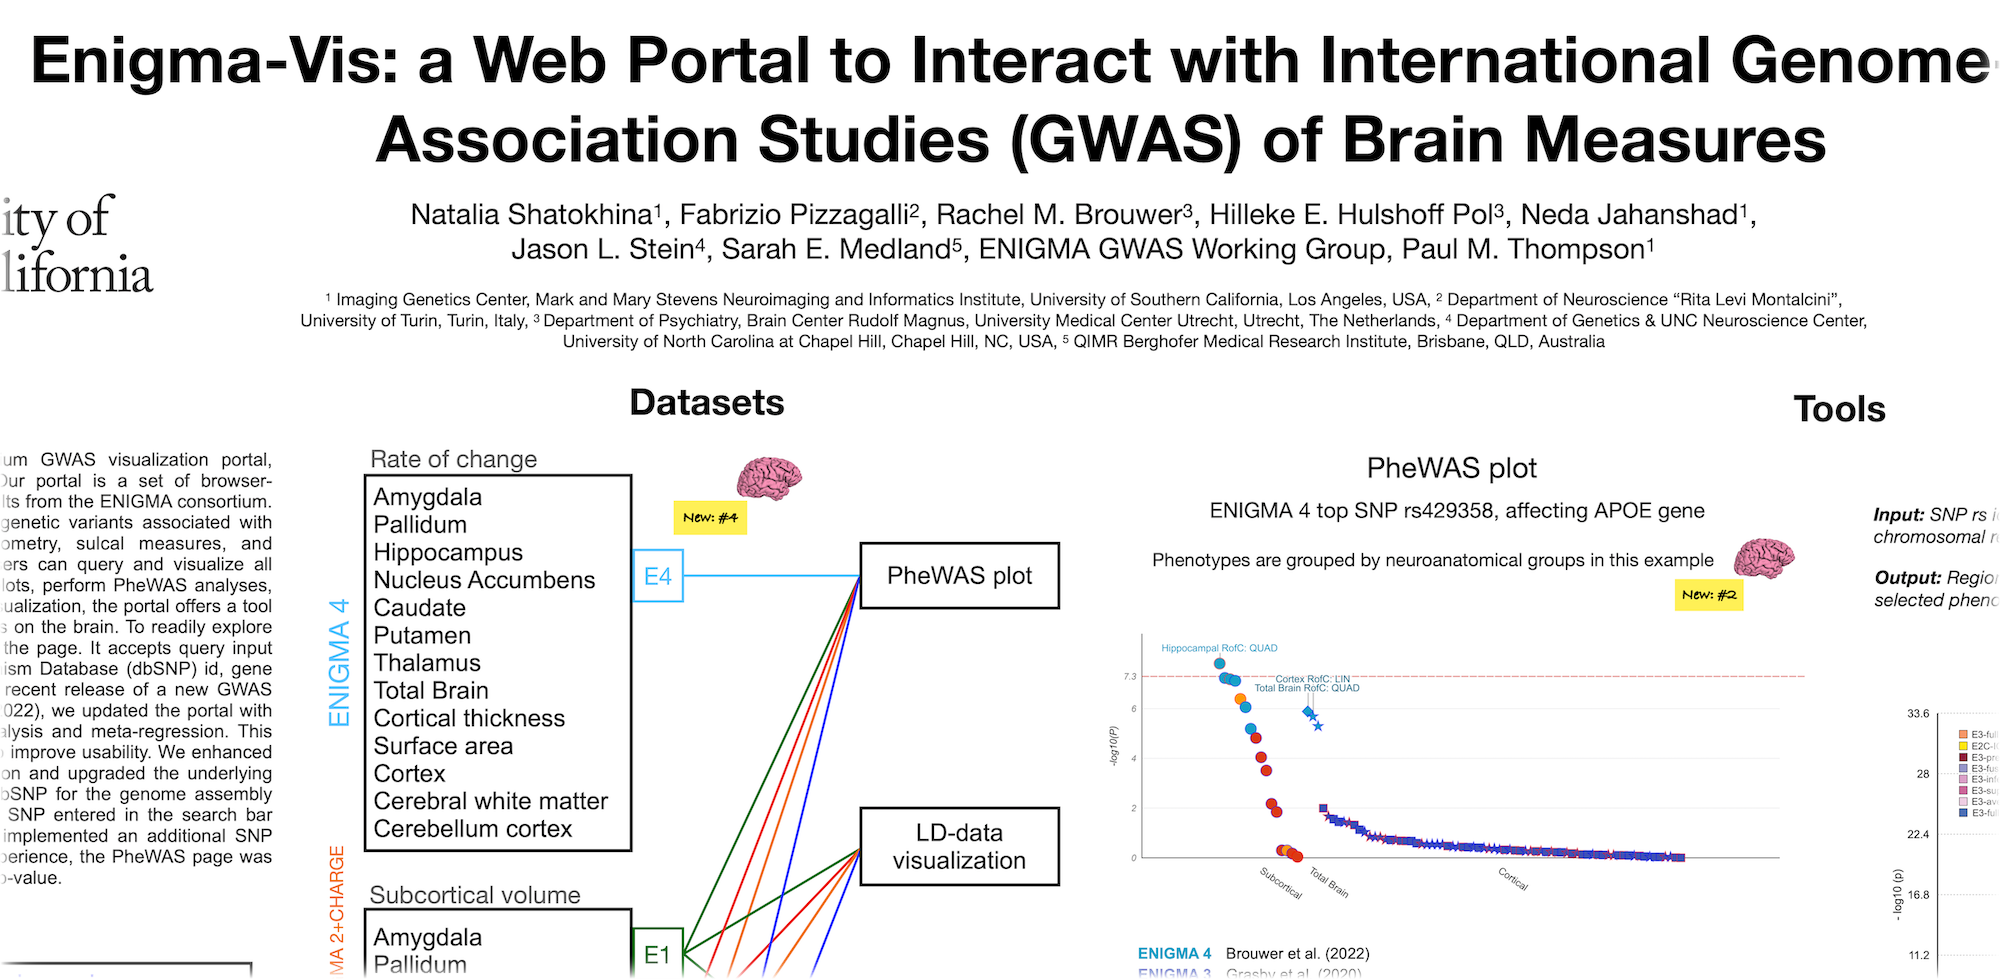
A poster for the SFN 2022 meeting.
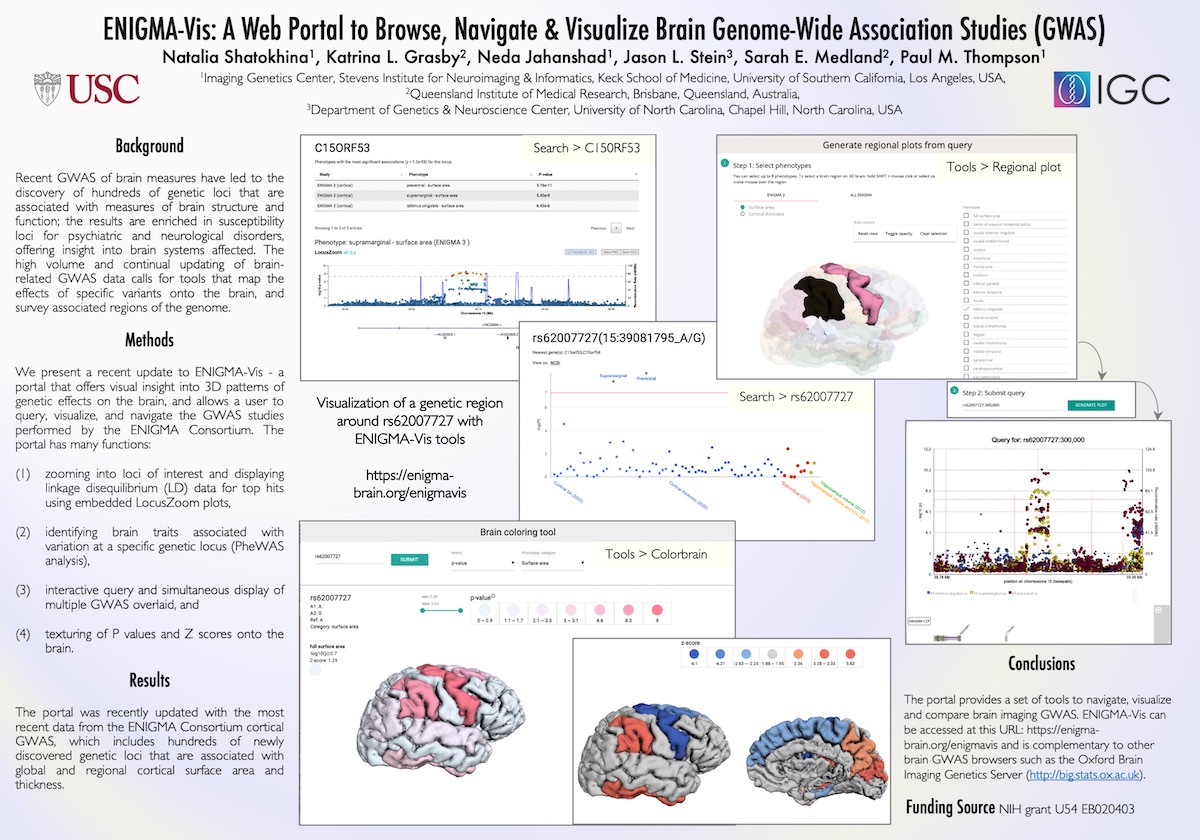
A poster for the SOBP 2021 virtual meeting.
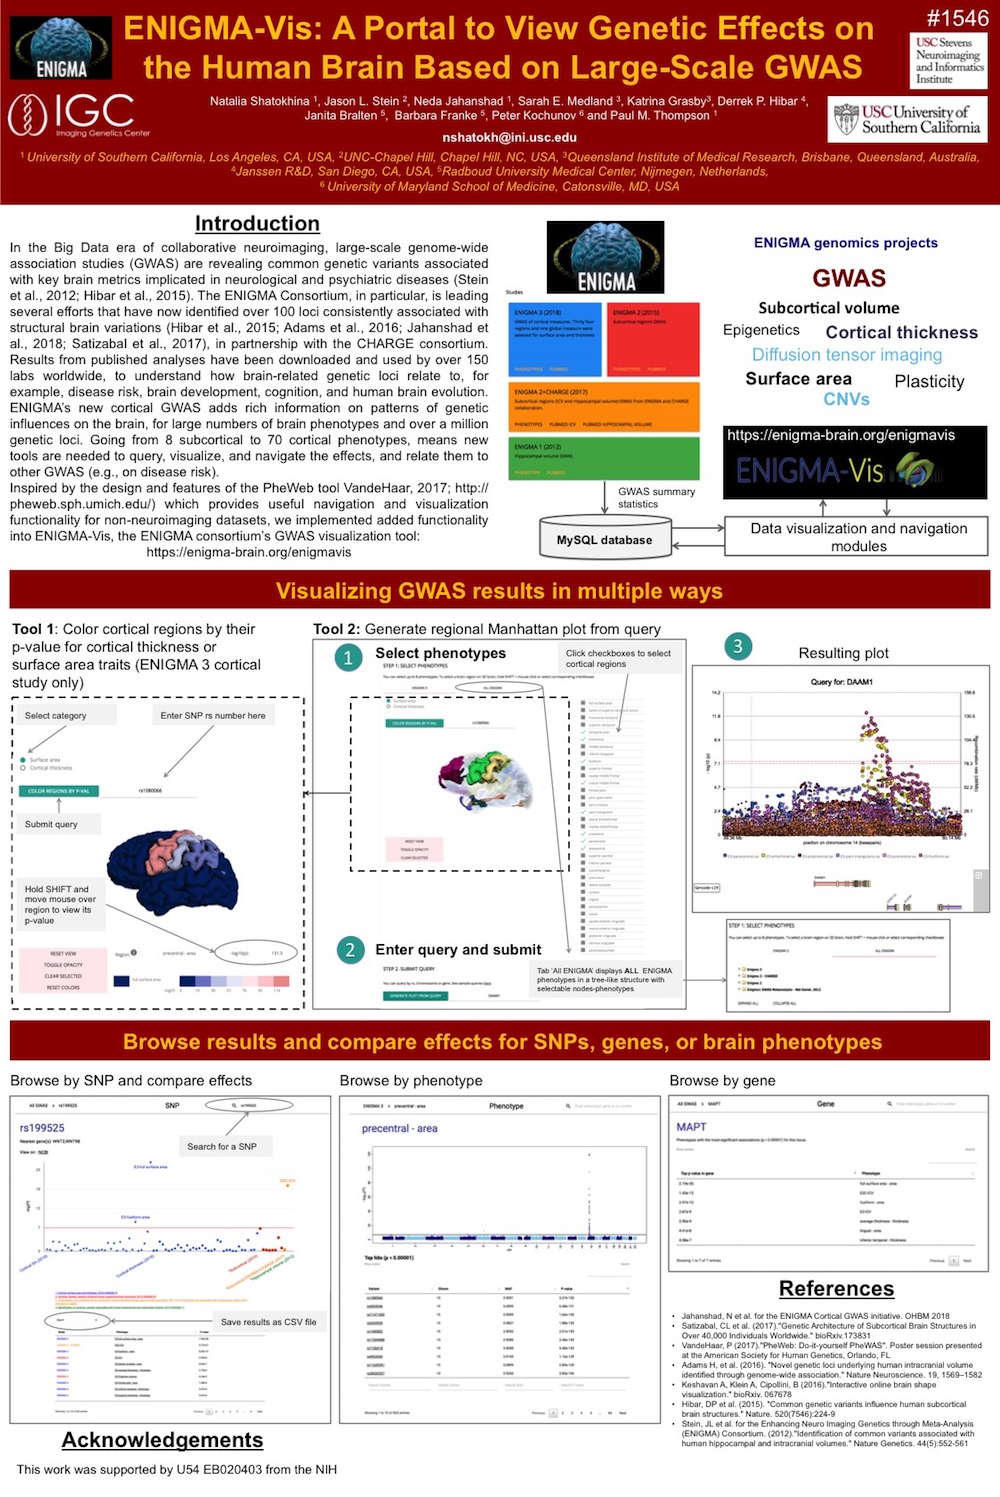
Our poster presented during poster session at the OHBM 2018 meeting in SINGAPORE.
Novak NM1, Stein JL, Medland SE, Hibar DP, Thompson PM, Toga AW. EnigmaVis: online interactive visualization of genome-wide association studies of the Enhancing NeuroImaging Genetics through Meta-Analysis (ENIGMA) consortium.
PubMed link
